Dashboard
- Accessing your dashboard, will give you view to all your onboarded sensors
- The Heliotics CORE Dashboard is a powerful, user-friendly platform designed for efficient IoT sensor management, data visualization, and analytics. It consolidates information from various IoT sensors into a centralized interface, providing insights at a glance and enabling effective decision-making without requiring deep dives into sensor-specific details
Finding Sensors Using Filters
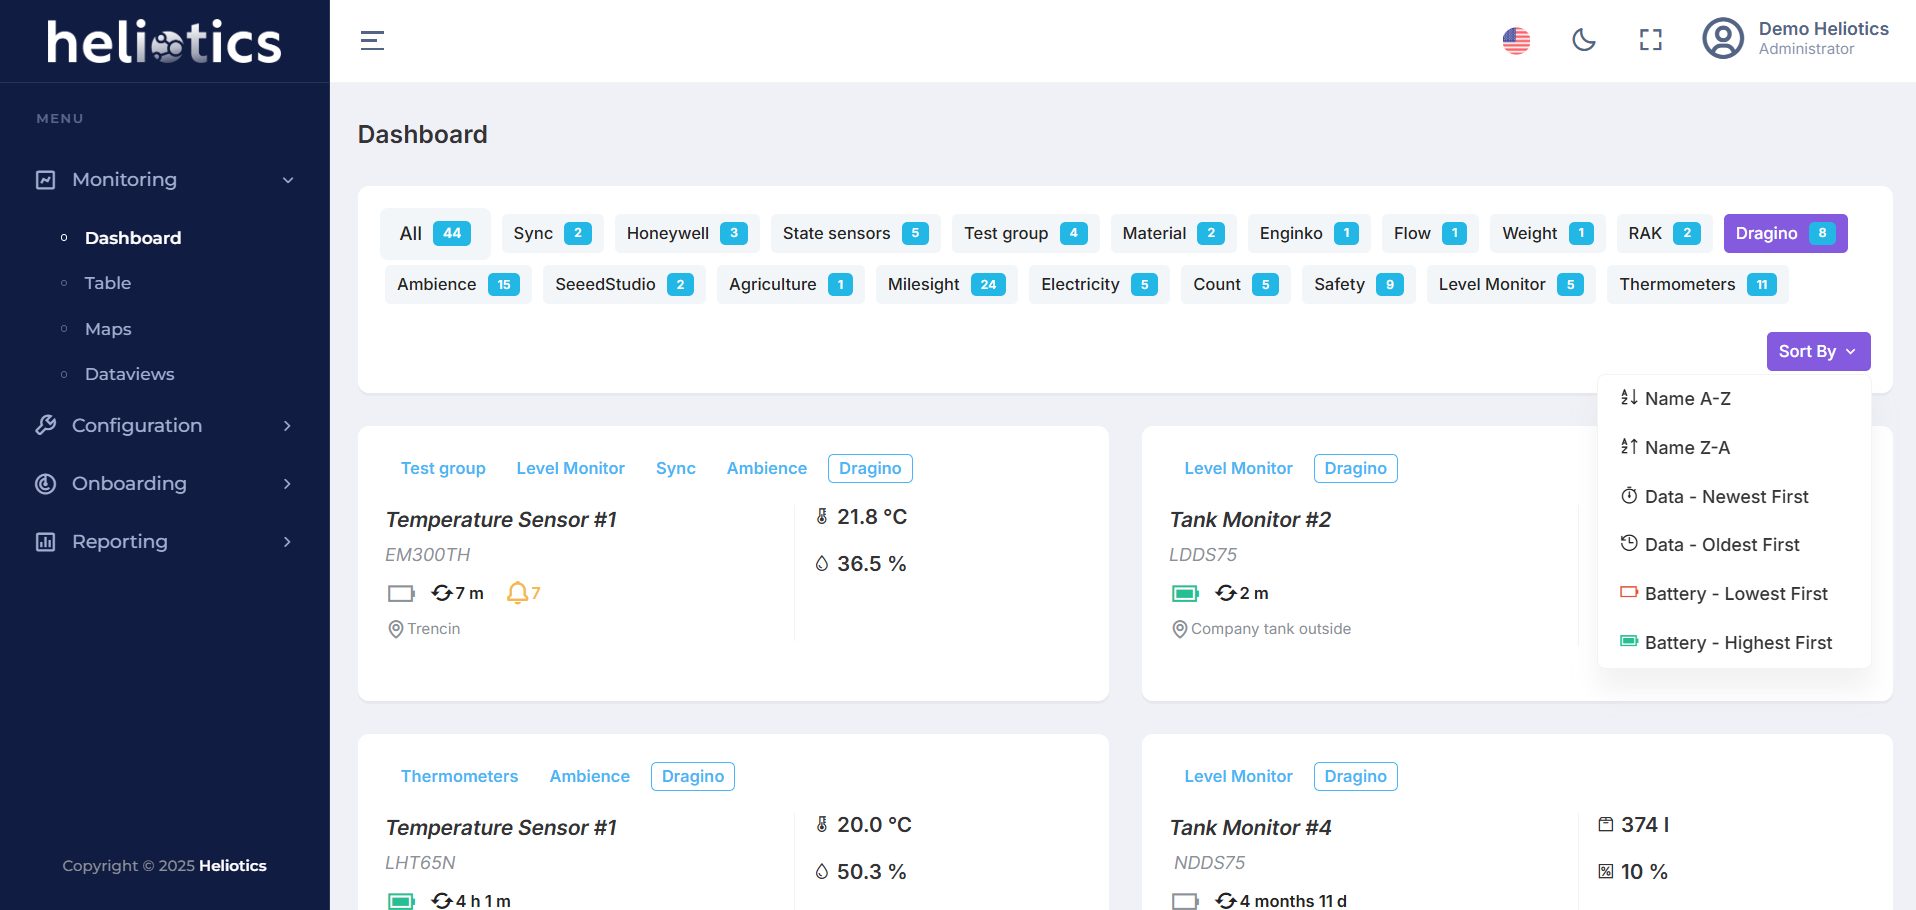
- Filters allow users to sort devices by created groups (e.g., energy, environment, tank, waste) or specific attributes like battery level, name, reported data
- Easily locate a specific device by searching within sensor groups
Visual Features of the Dashboard
Overview of Sensor Data
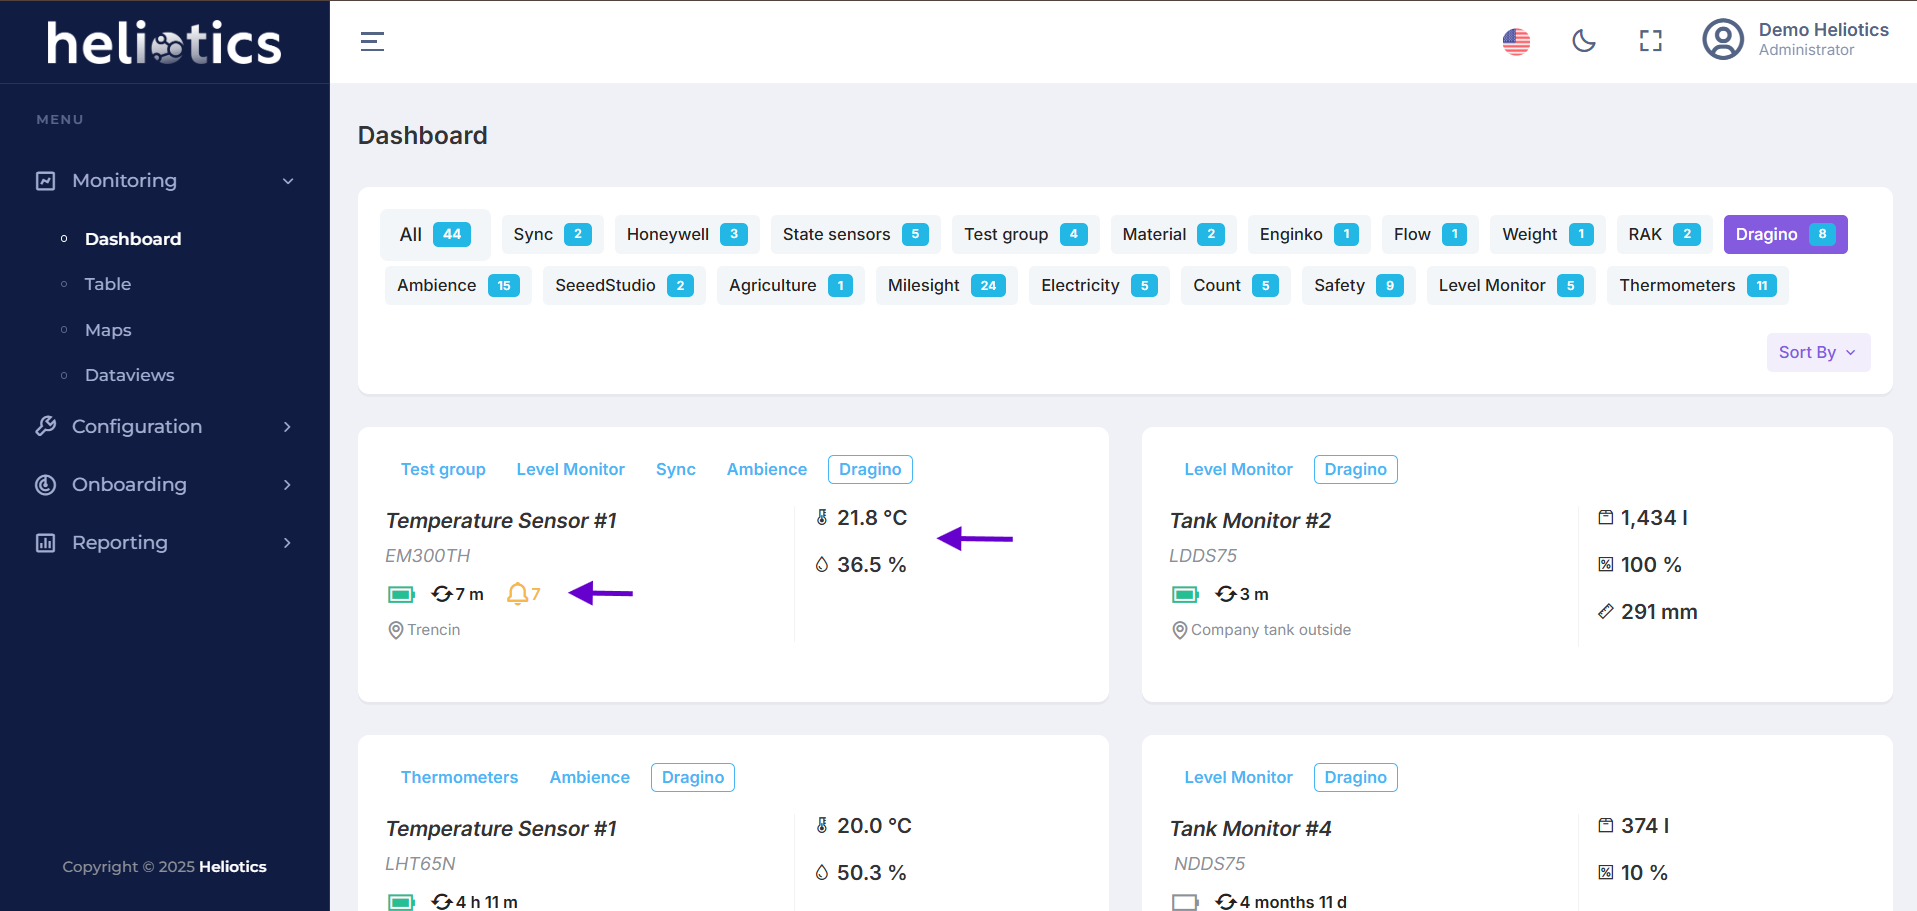
- The dashboard presents a real-time summary of connected IoT devices, grouped by categories such as energy, environment, tank levels, waste management or other created groups
- Key performance indicators such as energy usage, tank levels, and environmental conditions and much more are accessible on the dashboard without drilling into individual sensors
- This quick trend analysis provides valuable insights at a glance
Alerts and Notifications
- Displays alerts for anomalies or pre-defined triggers, such as leaks, temperature thresholds, or container overfills. This helps the user to respond in time and ensure predictive maintenance and reduction of downtime